
Attendance Dashboard
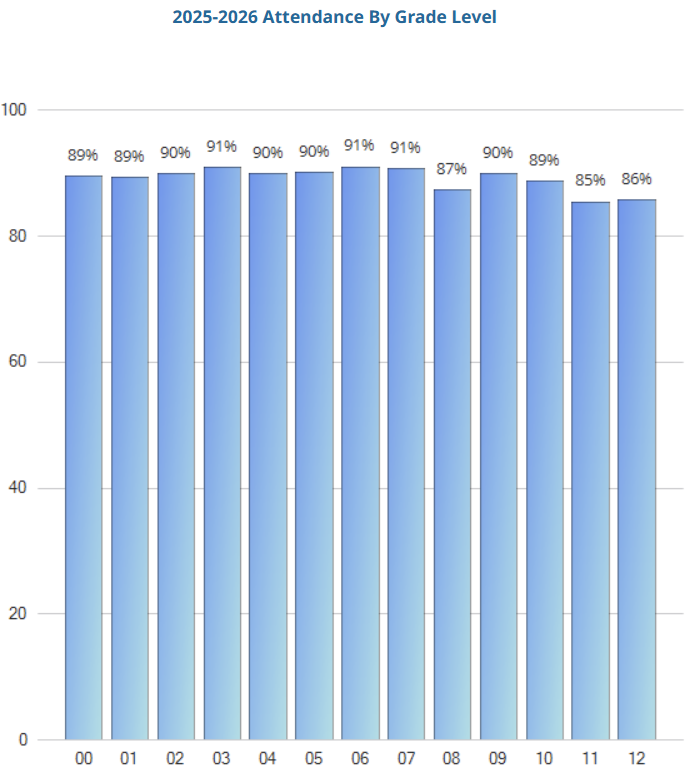
When looking at our school’s performance data, you will often see two different attendance metrics: Average Daily Attendance and Regular Attenders.
While they sound similar, they tell us very different stories about our students’ school experience.
Average Daily Attendance (ADA)
"How many students show up on a typical day?"
This is a daily "snapshot" of our school. It is calculated by taking the total number of students present and dividing it by the total number of students enrolled.
Current Monthly ADA Rates:
Regular Attenders
"How many students are here consistently enough to learn?"
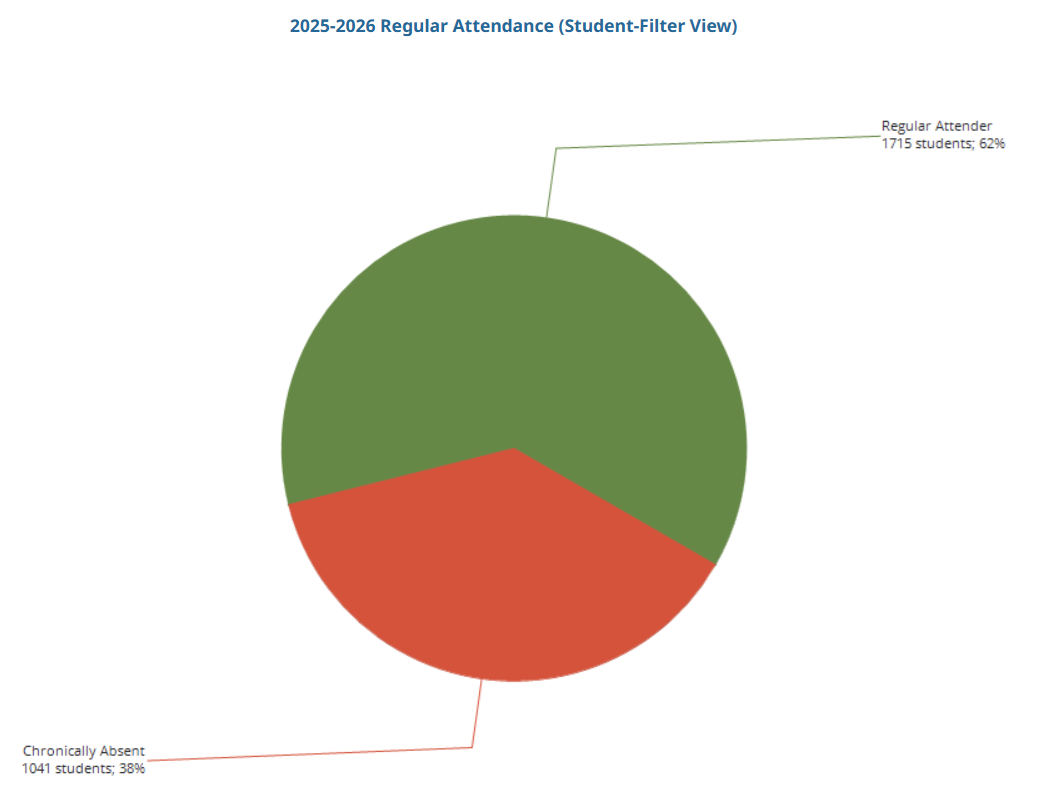
Oregon defines a Regular Attender as any student who attends school more than 90% of the time. This is the metric we watch most closely because it is a powerful predictor of student success.
Why it matters: Research shows that students who are Regular Attenders are significantly more likely to read at grade level by 3rd grade and graduate high school on time.
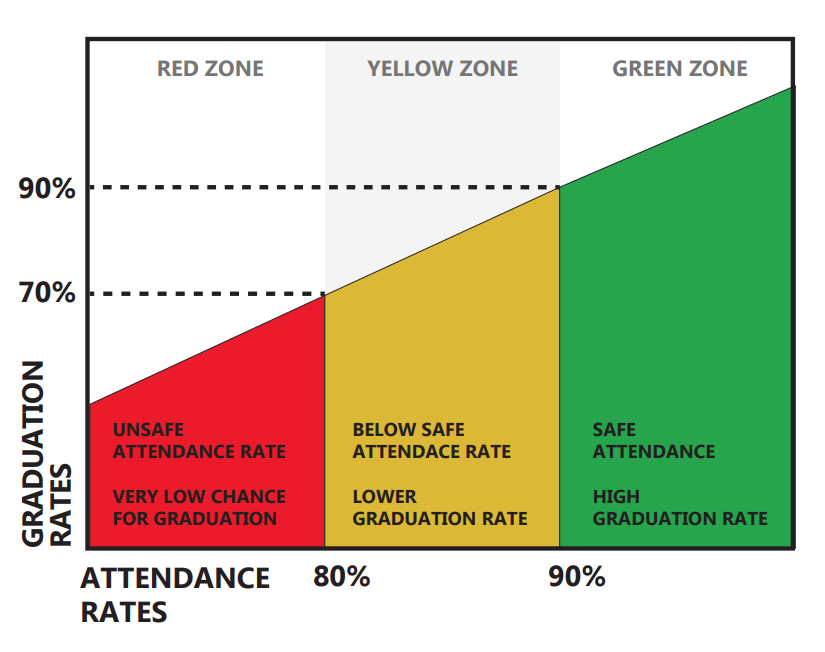
Why 90% Matters
Missing 10% of the school year, even if those absences are excused, results in "learning gaps." When a student is not a Regular Attender, they miss the foundational instructions needed to tackle the next day's lessons.
We want 100% of our students to be "Regular Attenders." If your family is facing barriers to getting your child to school, please reach out to our front office. We are here to help!
Regular Attender Rates (YTD)
At-a-Glance Comparison
Attendance by Month:
May Attendance
April Attendance
March Attendance
February Attendance
January Attendance
December Attendance
November Attendance
October Attendance
September Attendance